Onimusha: Way of the Sword closes out an incredible year for Capcom, following hot on the heels of both Resident Evil Requiem and Pragmata earlier in the year. Like those titles, the game is built on Capcom’s proprietary RE Engine, which has proven to be a remarkably scalable engine that can accommodate a wide range of hardware. We put some of the best CPUs for gaming through the game’s free benchmark to see how it scales on the CPU.
RE Engine is heavier on the GPU than the CPU, but still, we saw scaling across the 31 CPUs we tested, ranging from new releases like the Core Ultra 7 270K Plus, reaching back to relics of the past decade like the Ryzen 7 2700X. Largely, performance falls as you’d expect, but there were a few odd results that showed up in our testing, namely for AMD’s newer 12-core Ryzen 9 models, which struggle to keep pace in this game.
Regardless, the game runs well on a wide range of hardware. Even with the RTX 5090 Founder’s Edition we tested with the Ryzen 7 2700X, completely binding performance to the CPU, we neared 90 FPS at 1080p with Ultra settings and no ray tracing.
This is a cursory look at Onimusha: Way of the Sword using the in-game benchmark available (we’ll go over how we tested a bit later). As usual, performance will vary from scene to scene, and we’ve yet to reach the latest areas of the game, which may have an adverse impact on performance (though we don’t expect one). We are looking at how CPUs scale in the game more so than the raw frame rate of any individual chip.
CPU scaling in Onimusha: Way of the Sword
The Onimusha: Way of the Sword benchmark is about five minutes long, primarily consisting of two in-engine cutscenes rendered in real time. The back half of the benchmark features gameplay, which shows considerably lower performance and taxes the CPU far more than the cutscenes. We chose to benchmark during the gameplay section, naturally.
We tested with the Ultra preset without ray tracing enabled. We didn’t use DLSS or FSR, either. As usual, we tested at 1080p with the RTX 5090 Founder’s Edition to isolate CPU performance as much as possible. We’ll go deeper into the specific system configuration for each platform later in this article if you’re interested. For each CPU, we ran the benchmark three times and took the median result, discarding and rerunning any outliers.
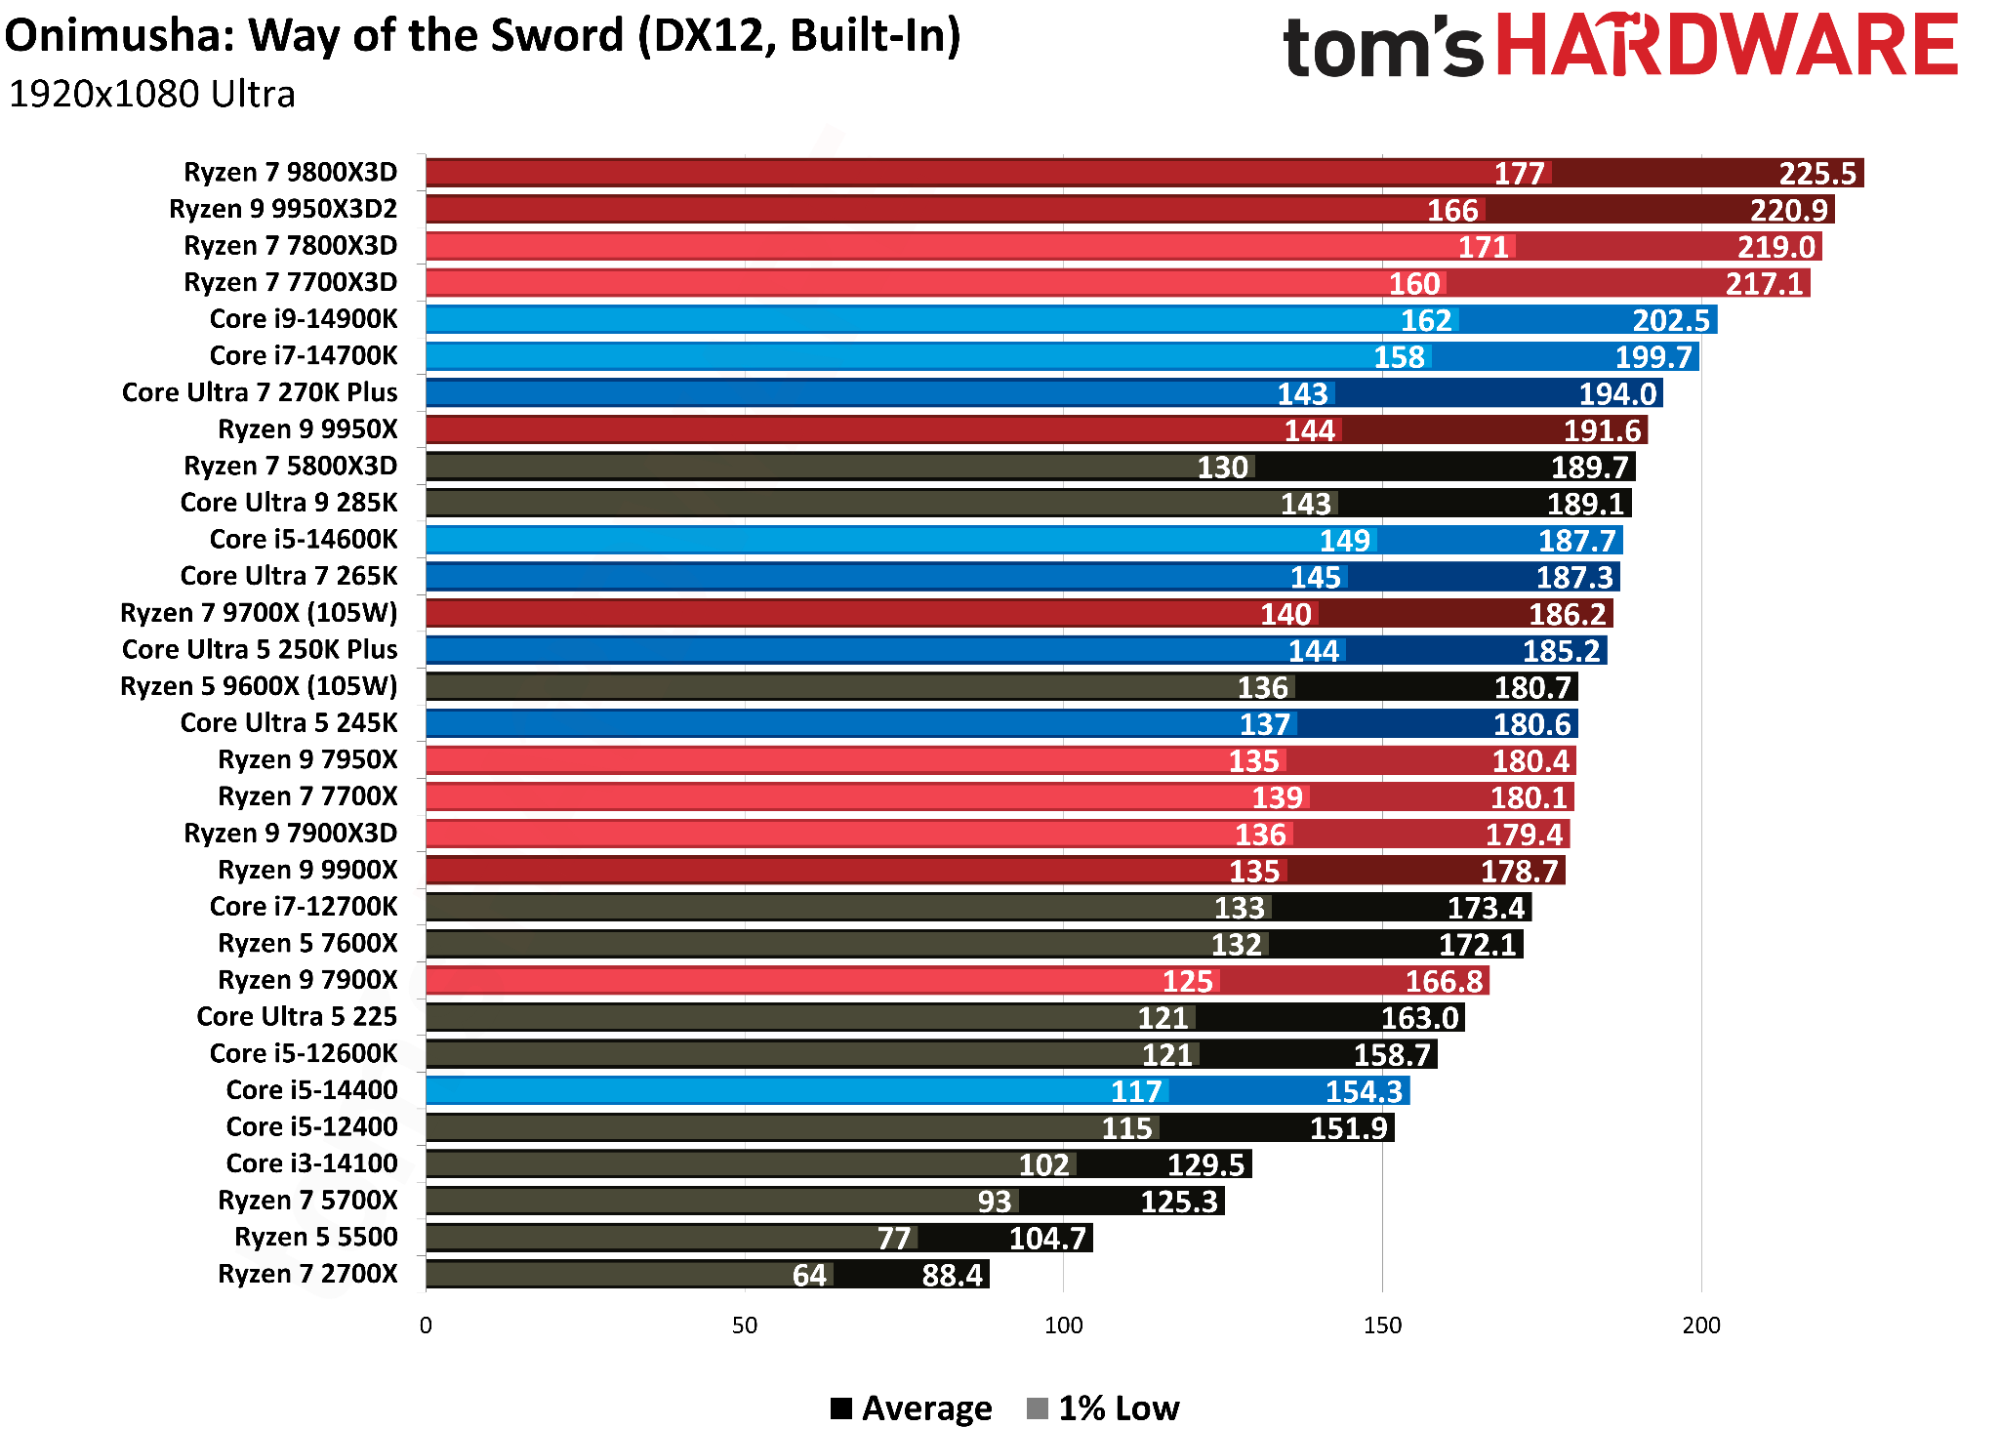
Out of the 31 CPUs we tested, the obvious ones to call out first are AMD’s 12-core Ryzen 9 offerings, because they perform poorly in this game. The Ryzen 9 7900X is actually 3% slower than the Ryzen 5 7600X, and similarly, the Ryzen 9 9900X is 1% behind the Ryzen 5 9600X. There’s clearly some issue with the 12-core parts, specifically, that doesn’t show up in the single-CCD Ryzen CPUs, nor the full, 16-core, dual-CCD models.
Great evidence of that is the Ryzen 9 7900X3D, which I only chose to run to see if 3D V-Cache would be able to overcome the 12-core penalty. It wasn’t able to. Every other X3D chip we tested sits at the top of the charts, while the Ryzen 9 7900X3D ended up in lockstep with the Ryzen 7 7700X. It’s possible this is a performance issue that either Capcom will address through a patch, or AMD through a firmware update. Regardless, the 12-core Ryzen 9 performance in this game is rough right now.
Elsewhere, things are great. X3D chips top the charts, though with less of a margin than we see in other titles, and virtually no margin in comparison to one another. The Ryzen 7 7700X3D is 7.2% ahead of the Core i9-14900K, Intel’s strongest CPU in this game, while the Ryzen 7 9800X3D extends that lead up to 11.3%. We didn’t have time to benchmark the Ryzen 7 9850X3D, though based on the negligible performance gap between the 7700X3D and 7800X3D, don’t expect any miracles.
The Ryzen 7 5800X3D doesn’t reach the heights of its DDR5-equipped siblings, falling 13.4% behind the Ryzen 7 7800X3D. It still puts on an excellent showing considering its peers, sitting among the Core Ultra 9 285K and Ryzen 9 9950X. Even four years down the road, the Ryzen 7 5800X3D delivers performance on the level of current-gen flagships, at least in this title.
In Intel’s camp, the Core i9-14900K remains the fastest chip in Onimusha, at least when equipped with DDR5 (read our DDR4 vs DDR5 Raptor Lake comparison to see the difference in performance). Unfortunately for Team Blue, even the Core i7-14700K is 2.9% faster than Intel’s latest Core Ultra 7 270K Plus in this game. Intel doesn’t have support for Onimusha with iBOT, nor any RE Engine titles, suggesting that the performance you see here is the cap for Arrow Lake Refresh. Hopefully that changes with Intel’s impending Nova Lake.
Although Arrow Lake and AL Refresh don’t scale as high as the 14th-Gen offerings, performance is still solid competitively. The Core Ultra 5 245K is in lockstep with the Ryzen 5 9600X, as expected, while the lowly Core Ultra 5 225 is nipping at the heels of the Ryzen 5 7600X.
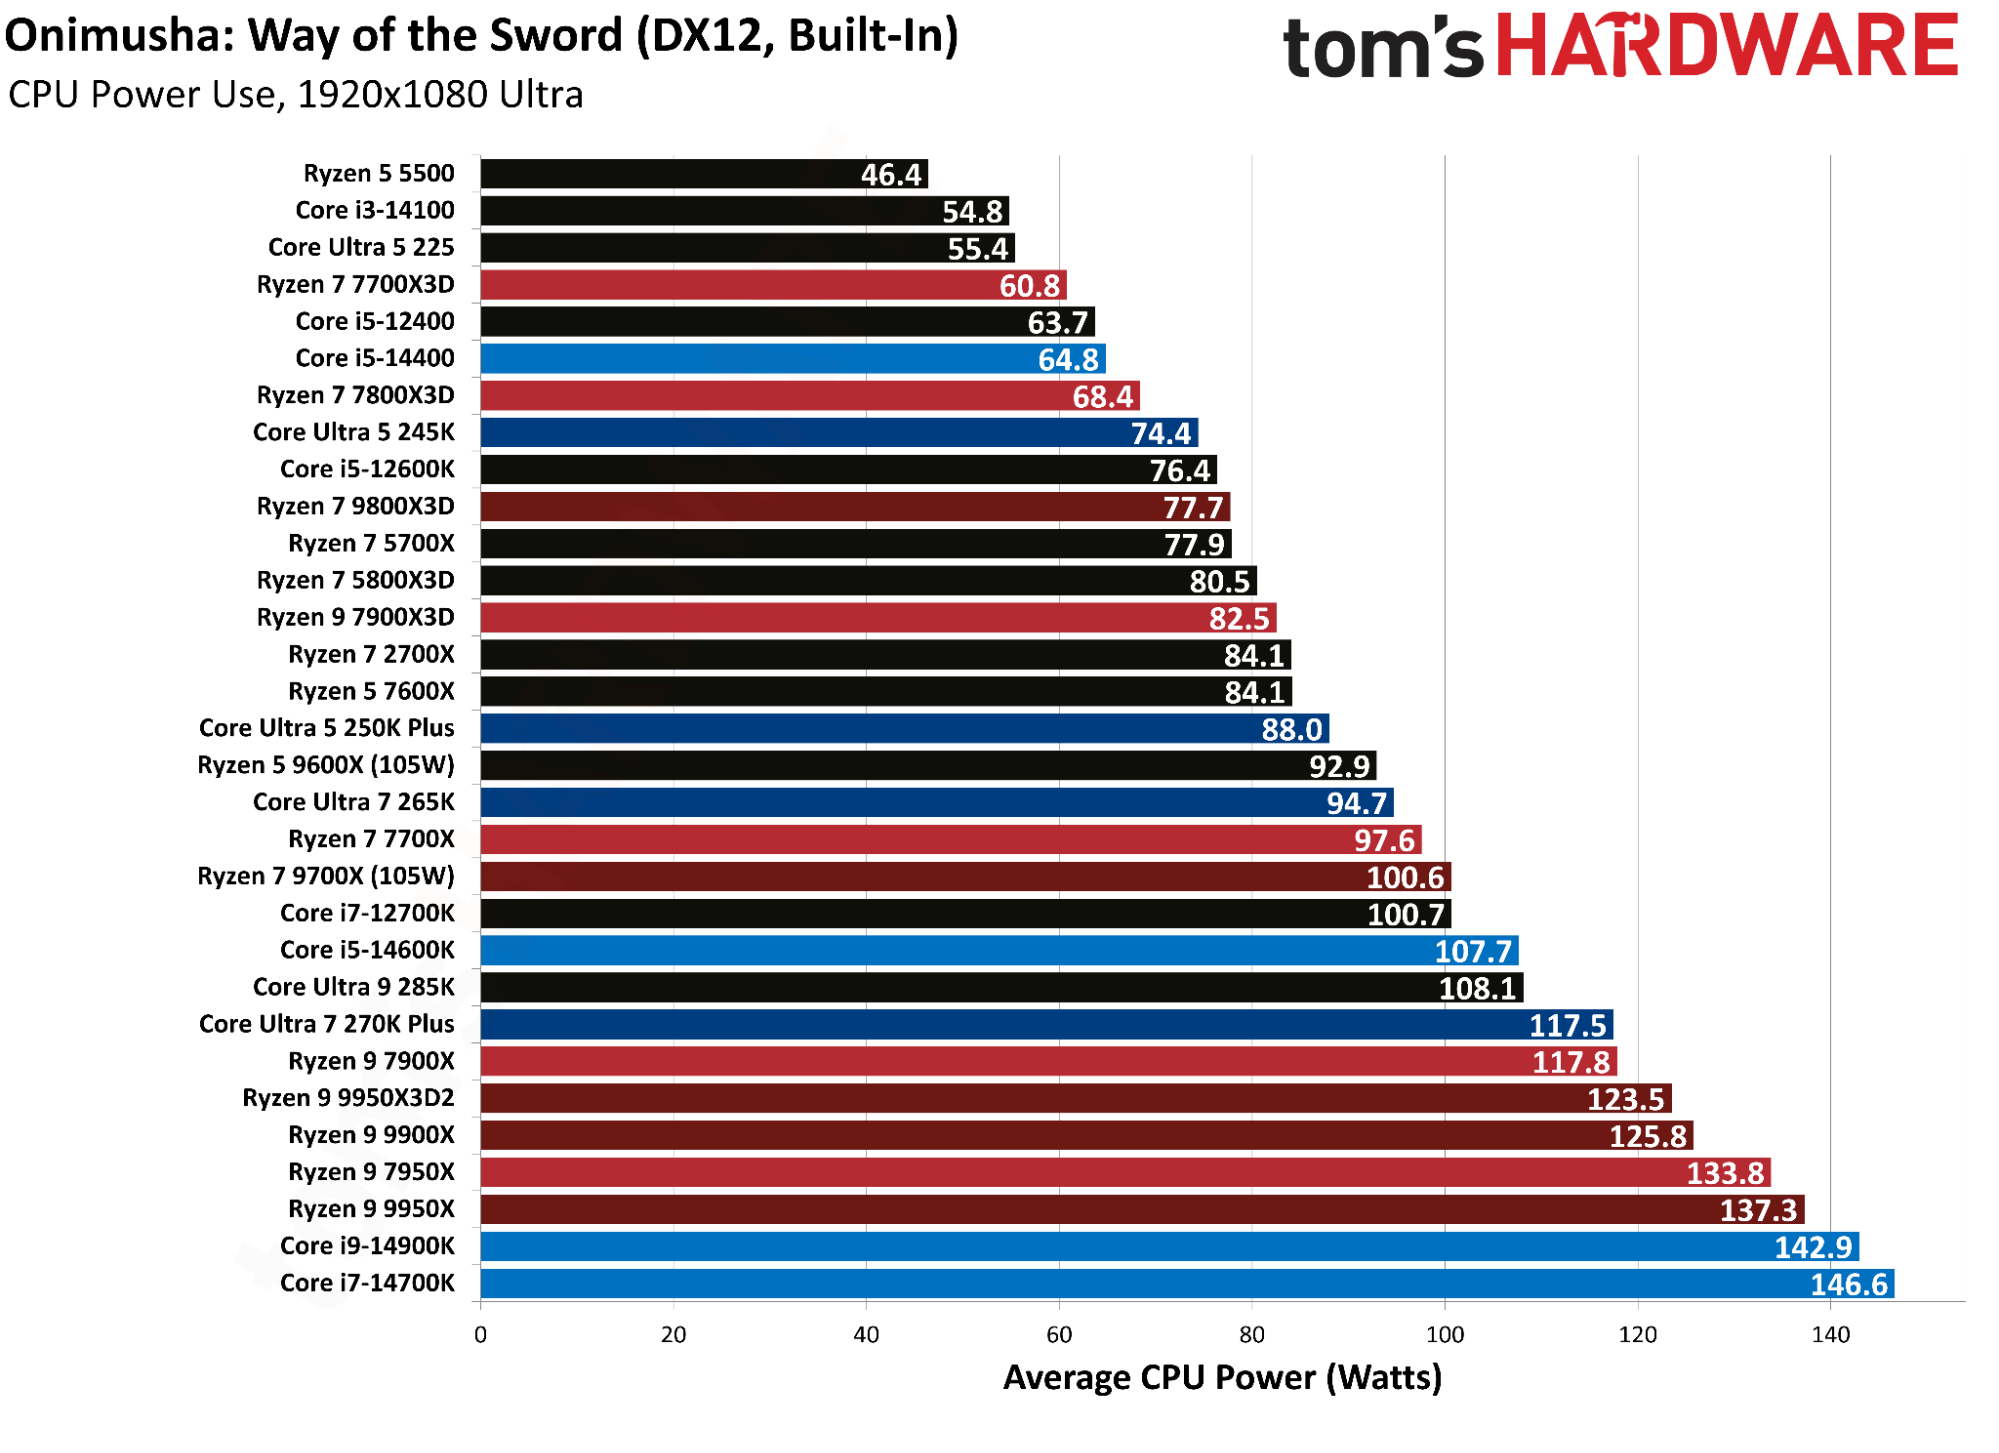
Flipping over to power, X3D chips remain well under 100W, short of the dual-CCD, dual-cache Ryzen 9 9950X3D2. Intel’s Raptor Lake Refresh chips unsurprisingly had the highest power usage out of our test pool, with the Core i7-14700K actually drawing a bit more power than the Core i9-14900K. Although we ran the test multiple times, we took the median result for average frame rate, which can sometimes push neighboring figures out of sorts when looking at other metrics. We don’t want to mix power results from one run and performance from another.
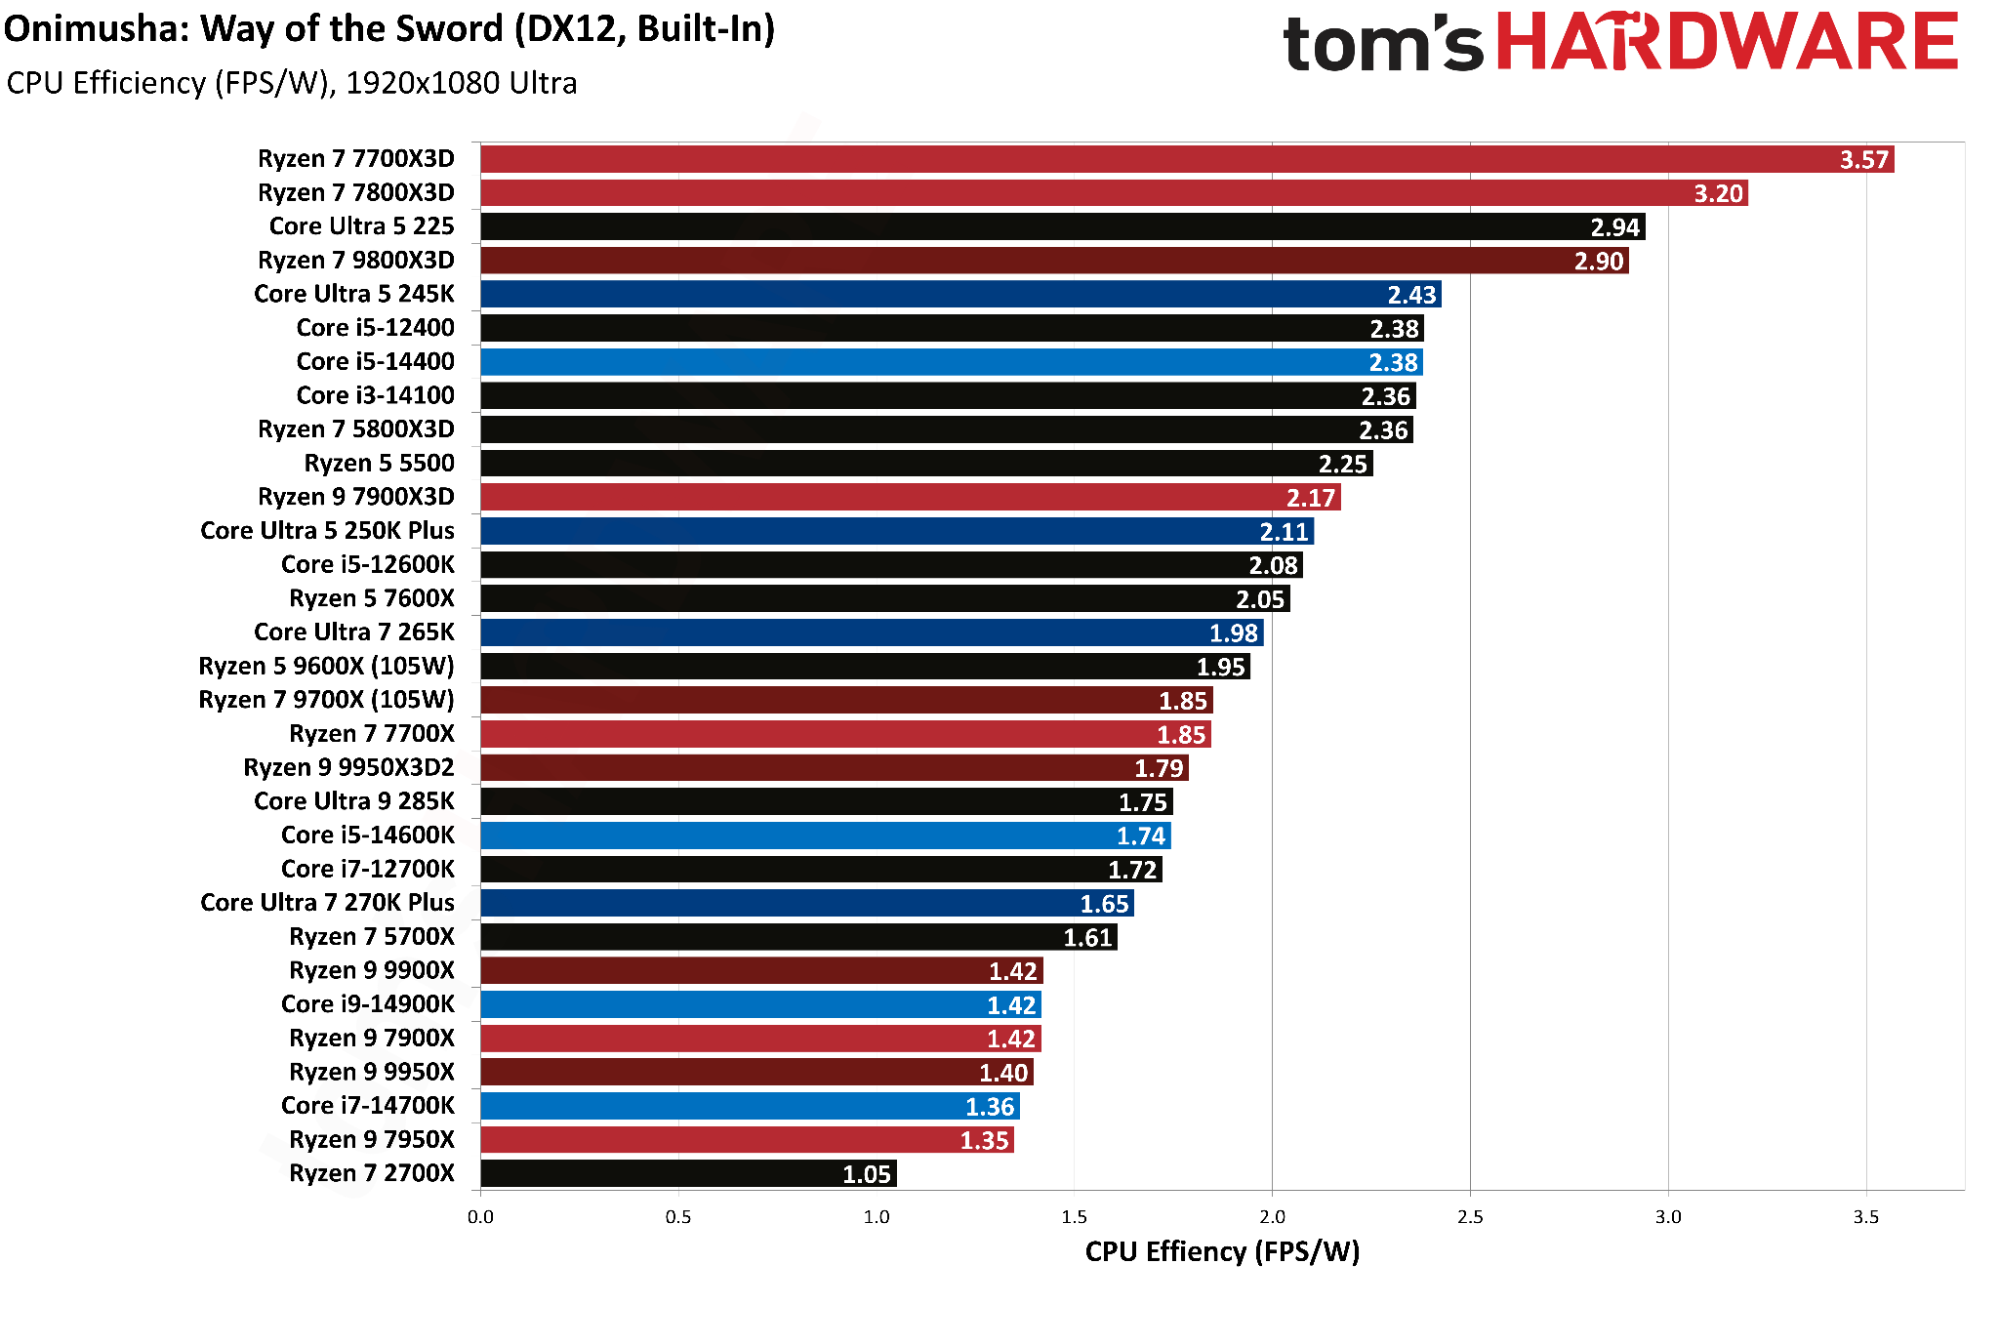
Looking directly at efficiency, the Ryzen 7 7700X3D was the most efficient chip in our testing, offering up just over 3.5 frames per watt consumed. The Ryzen 7 7800X3D barely offered a performance benefit over the 7700X3D, so its efficiency suffers as a result. Even the Ryzen 7 9800X3D falls below the 3-frames-per-watt mark.
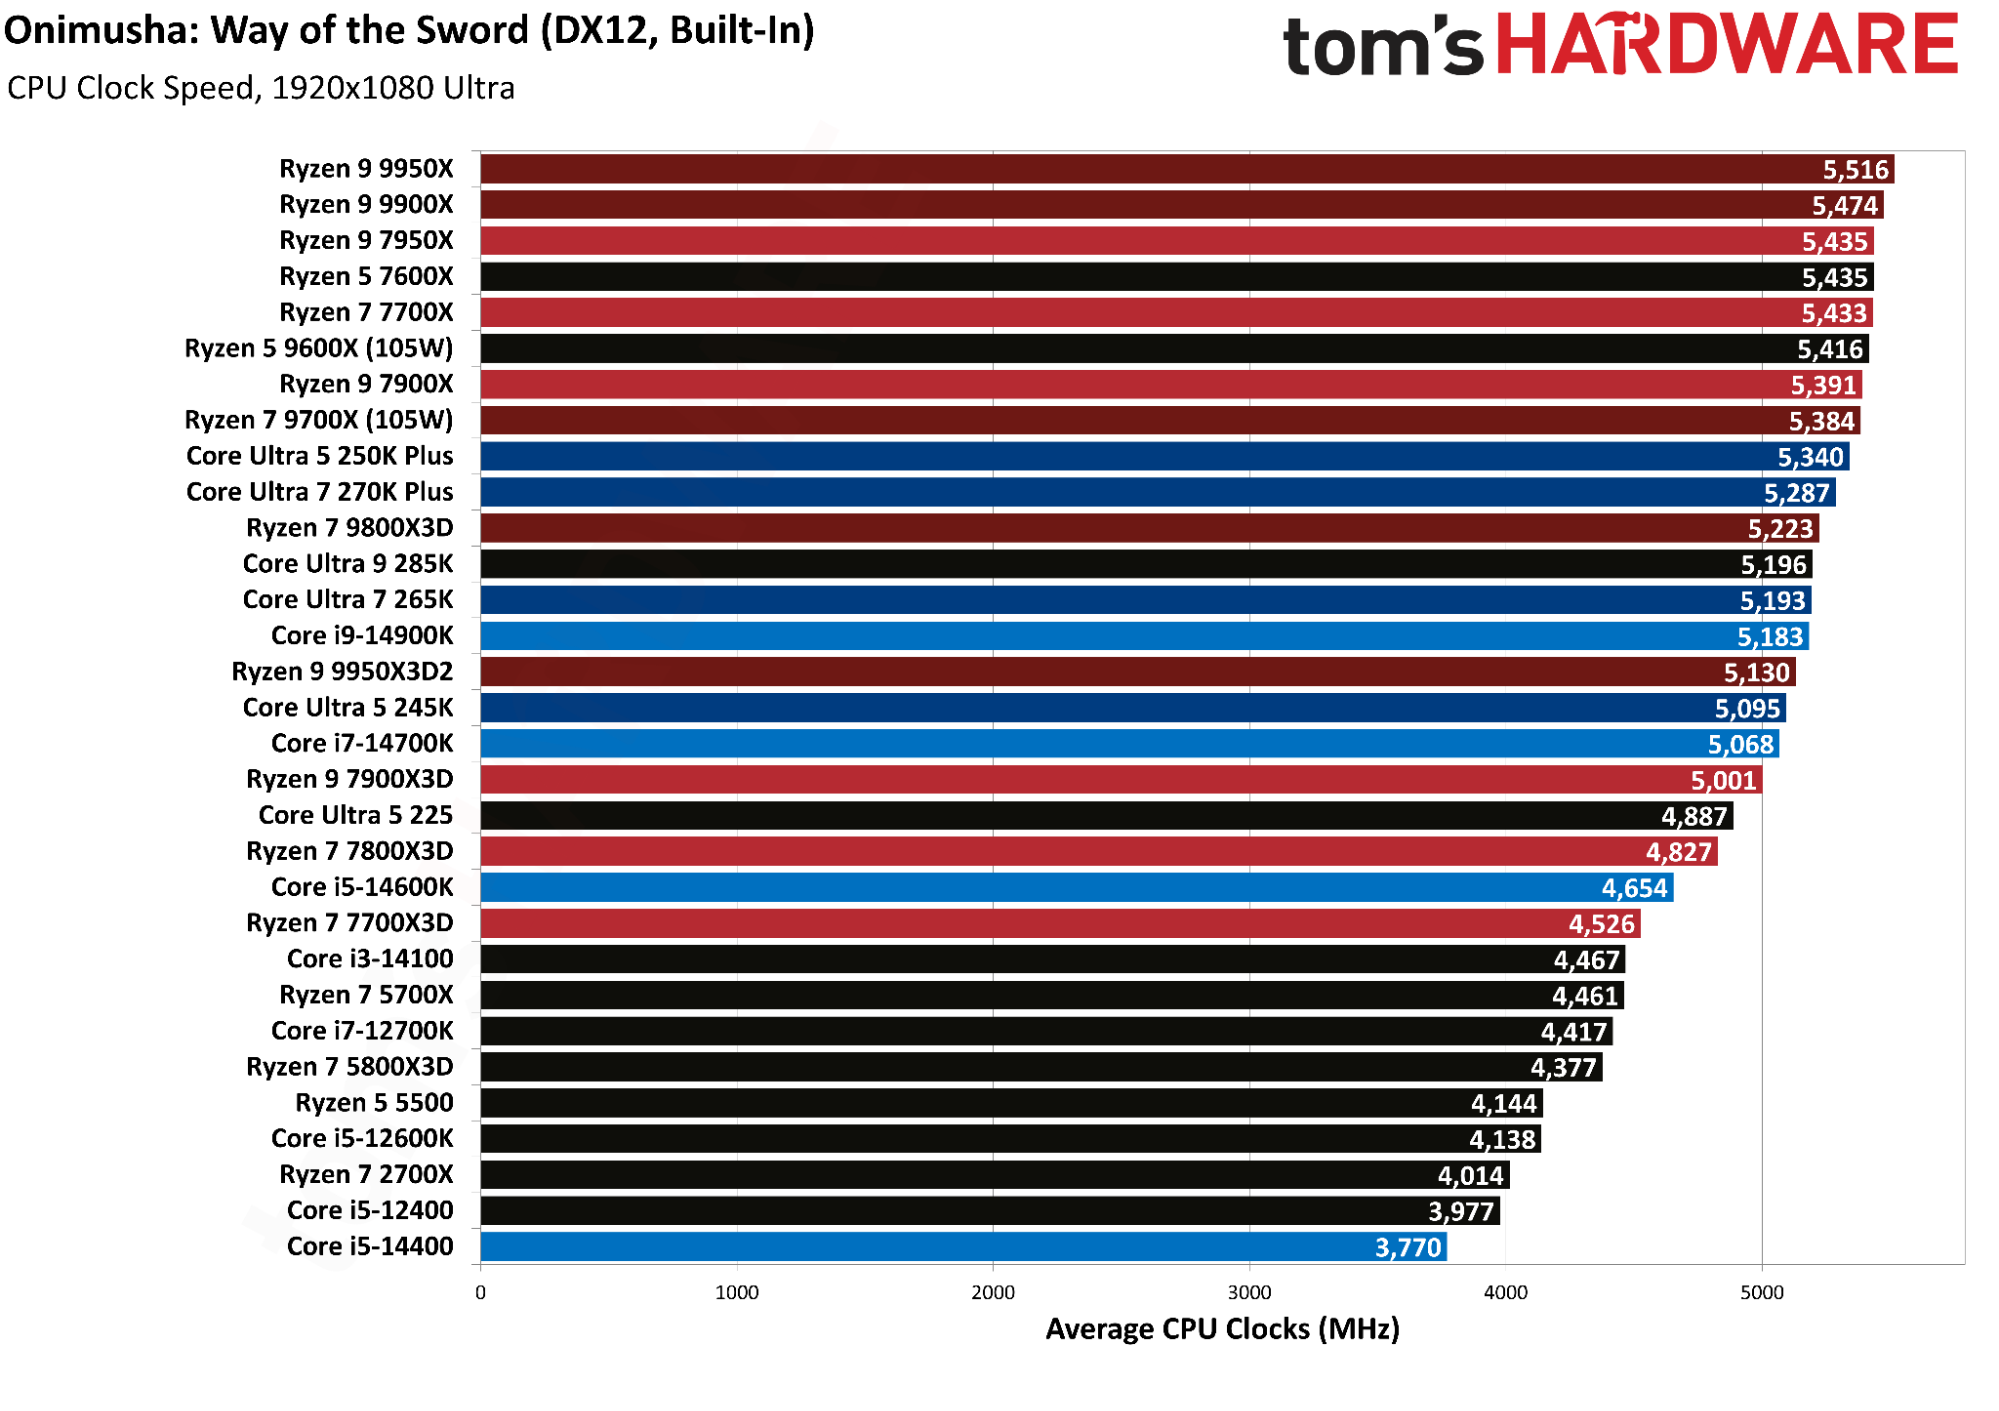
Finally, clock speed doesn’t offer a lot of surprises. The more efficient CPUs like the Ryzen 7 7800X3D ran right up against their maximum boost clock on average, while flagships that push single-core speed to the limit like the Ryzen 9 9950X and Core i9-14900K fall below their maximum boosts. Clocks don’t translate into performance here, though looking at this chart combined with our averages provides some insight into how threaded Onimusha is.
It’s lightly threaded, like the vast majority of games, though there’s a clear bump in performance beyond four cores. Combined with lower maximum boost clocks on high-core-count flagships, all-core clocks are certainly more relevant here than single-core boosts. Then again, clock speed isn’t a major factor here, regardless.
How we tested Onimusha: Way of the Sword
We used our normal test bench used for CPU reviews, as well as our CPU benchmark hierarchy testing. The hardware doesn’t change, short of the CPU and, when necessary, the motherboard and memory. We also use a frozen OS image, meaning we’re running the same versions of the same software with all the same dependencies for each test pass.
The GPU we used is the RTX 5090 Founder’s Edition, as our goal when looking at CPU scaling is to isolate the CPU’s performance as much as reasonably possible. Naturally, running a game at a low resolution like 720p and turning down all of the graphics options will put even more pressure on the CPU, but that pushes beyond isolating the performance of one component in a relatively realistic testing environment.
Intel LGA 1851 (Arrow Lake and Refresh)
Intel LGA 1851 (Arrow Lake and Refresh) | |
Motherboard | |
RAM | |
Intel LGA 1700 (Raptor Lake, Alder Lake) | |
Motherboard | |
RAM | |
AMD AM5 (Zen 5, Zen 4) | |
Motherboard | MSI MPG X870E Carbon Wi-Fi, Gigabyte Aorus X870E Elite X3D ICE |
RAM | |
AMD AM4 (Zen 3) | |
Motherboard | Asus TUF Gaming X570-Pro Wi-Fi |
All Systems | |
Gaming CPU | Nvidia GeForce RTX 5090 Founder’s Edition |
Application GPU | Nvidia GeForce RTX 2080 Ti Founder’s Edition |
Cooler | Corsair iCue Link H150i RGB |
Storage | 2TB Sabrent Rocket 4 Plus |
PSU | |
Other | Arctic MX-4 TIM, Windows 11 Pro, Alamengda open test bench |
Although the hardware is consistent, there are BIOS tweaks we make depending on the platform. As a broad rule, anything we enable that improves performance is covered under warranty. If performance-enhancing features void the warranty, we leave them disabled. That includes AMD’s Precision Boost Overdrive and Intel’s Extreme power profile. We also don’t enable any motherboard-specific performance enhancements, such as tweaked XMP/EXPO profiles or X3D enhancements.
For this test pool, there are some features still covered by the warranty that improve performance. In Intel’s camp, we tested with Core Ultra 200S Boost enabled on all supported Arrow Lake CPUs (the 225 doesn’t support the feature). Similarly, the Ryzen 5 9600X and Ryzen 7 9700X run at a 65W TDP out of the box, but an optional, warrantied 105W TDP mode is available. We tested with that mode enabled.
We also disabled Virtualization-Based Security (VBS), as it can adversely affect gaming performance.